
Predictive Analytics for Affiliate Offer Selection & Timing (Without Last-Click Lies)
Predictive Analytics for Affiliate Offer Selection and Timing (Without Lying to Yourself)
TL;DR
Predictive analytics can improve affiliate offer selection and timing—but only if you define “success” as incremental, margin-safe value (not last-click capture), instrument tracking end-to-end, segment partners by type, and bake in refunds + fatigue signals. Start with an auditable spreadsheet score, then layer time-series features and incrementality tests before automating decisions.
Key takeaways
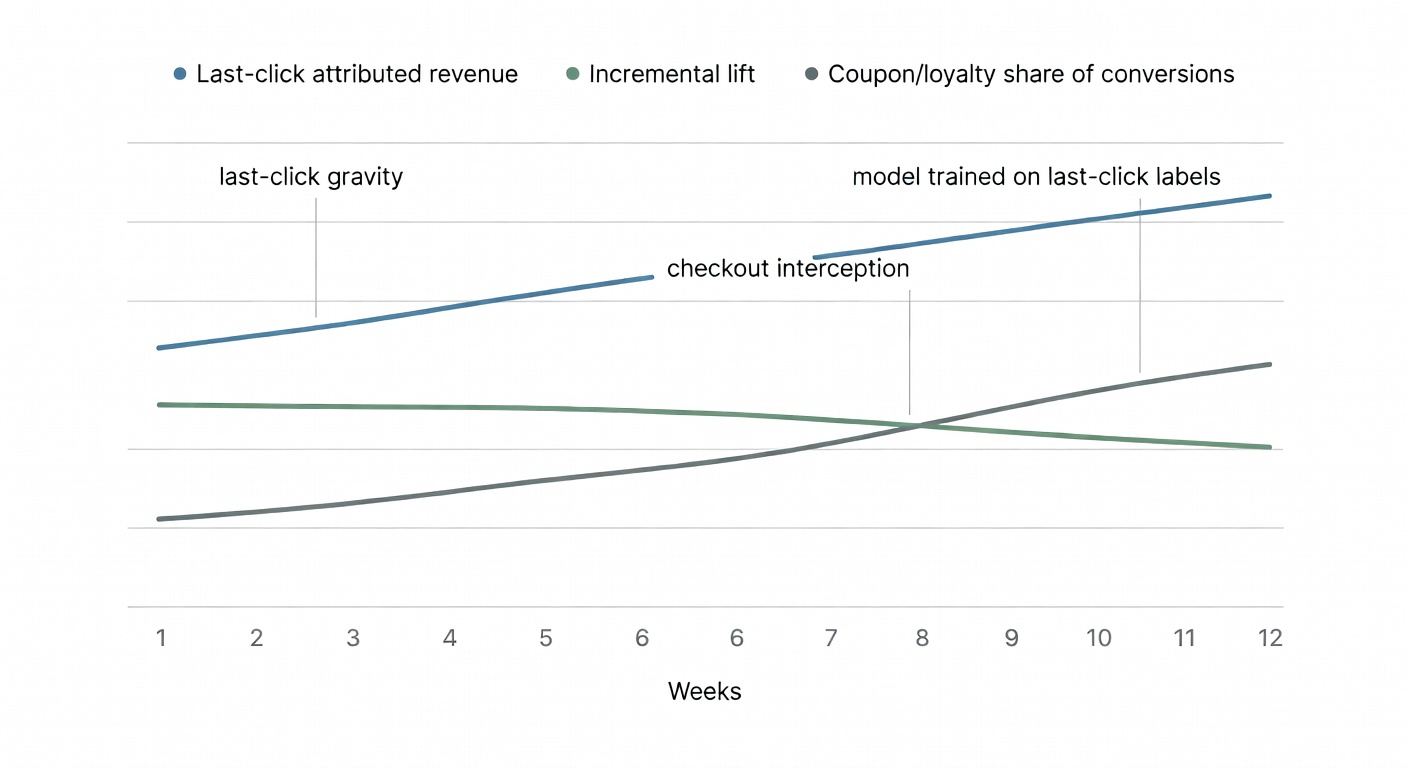
- Choose an outcome you can defend: if you train on last-click conversions, your model will “discover” coupon/loyalty checkout interception and call it performance—use incrementality to validate lift.
- Use auditable targets: CVR, EPC (ideally margin-adjusted), AOV, refund/return rate, new-to-file share, and (carefully) LTV—so recommendations map to real decisions and can be checked.
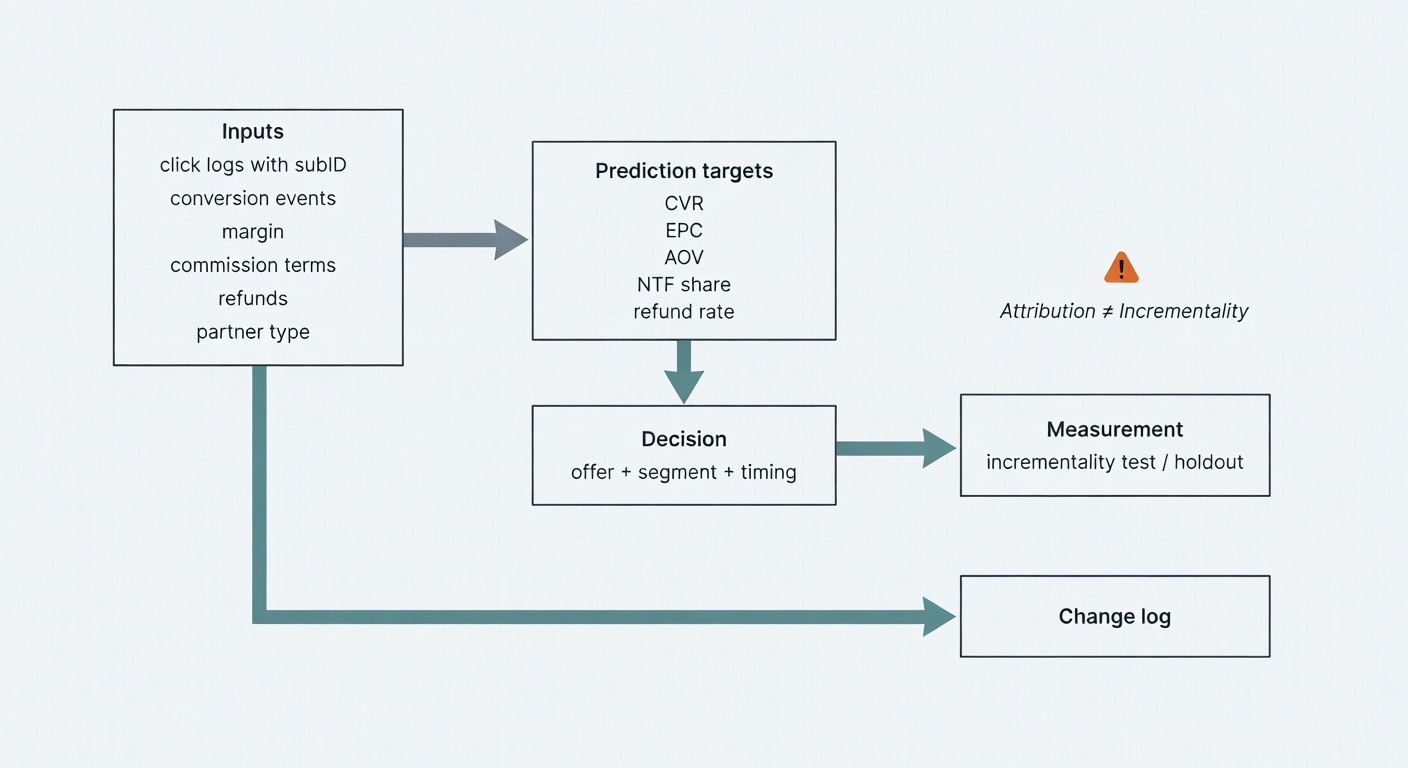
- Instrumentation beats modeling: you need click→conversion stitching (subIDs, timestamps, dedupe), commission terms, refunds, device/geo, promo metadata, and partner type—or the model will hallucinate patterns.
- Segment partners before you predict: content/creator/coupon behave differently; pooling them creates fake averages and bad “best offer/best time” guidance.
- Start with a spreadsheet scoring model: expected contribution = predicted orders × (AOV × margin) × (1−refund) − commissions − fees, then discount by an incrementality confidence factor.
- Timing = “when to push” + “when to stop”: build partner/placement-specific daypart patterns and feed fatigue signals (CTR/CVR decay, frequency, rising costs, negative feedback) to trigger rotation/suppression.
- Build in stages, not vibes: baselines → time-series features → incrementality validation (holdouts/geo/pause tests) → automated decisioning with guardrails, monitoring, and an explicit change log.
“Predictive analytics for affiliate offer selection and timing” sounds clean on a slide. In practice, it’s a decision system that either (a) helps you pick the right offer for the right segment at the right moment, or (b) quietly optimizes for last-click capture and calls it “performance.”
This post is the version that survives messy attribution, last-click gravity, and creative fatigue. We’ll connect forecasting + incrementality + fatigue signals into one operational loop—because treating those as separate projects is how you end up with a model that’s technically impressive and strategically wrong.
No incrementality, no confidence.
Start with the uncomfortable definition: what are you predicting—revenue, incremental lift, or just last-click capture?
Before you build anything, name the outcome variable. Not “sales.” Not “ROAS.” The thing you’re actually optimizing.
Because affiliate has gravity. Last-click gravity.
If you train a model on last-click conversions, it will learn to love the partners who show up last—coupon, loyalty, toolbars, “deal” placements that intercept checkout—and it will recommend more of the same. That’s not machine learning. That’s you paying for proximity.
Okay—now let’s look at what breaks when you skip this.
Attribution vs. incrementality (and why your model will pick coupon sites if you let it)
Attribution is transaction-level crediting. Incrementality is behavior change across groups—what happened because the channel existed, versus what would’ve happened anyway. CJ’s incrementality whitepaper is explicit here: incrementality is not attribution, and it’s independent of the attribution model you use to assign credit within a transaction path (Junction by CJ).
Acceleration Partners’ recap from Affiliate Summit East puts it bluntly: last-click “ignores everything that happens before the final touchpoint” (Acceleration Partners). If your training labels are last-click, your model will optimize for the final touchpoint. It’s not being evil. It’s being literal.
So the rule is:
Comparison: A 2-column table contrasting Attribution vs Incrementality across: definition, unit of analysis (path vs groups), typical data source, what it’s good for (payouts/ops vs validation), common failure mode (last-click gravity vs underpowered tests), and the key question each answers (“who gets credit?” vs “did we create lift?”).
| Dimension | Attribution | Incrementality |
|---|---|---|
| Definition | Assigns credit for a conversion across touchpoints in a customer journey (e.g., last-click, linear, position-based). | Estimates the causal lift from a channel/partner/offer: what happened because it ran vs what would have happened anyway. |
| Unit of analysis | Paths and touchpoints within a transaction (user journey / conversion path). | Groups and outcomes (test vs control; exposed vs unexposed cohorts). |
| Typical data source | Tracking logs and platform reports: clicks, impressions, referral IDs, conversion pixels, affiliate network attribution exports. | Experiments or quasi-experiments: holdouts, geo tests, audience splits, partner on/off tests, matched-market designs. |
| What it’s good for | Payouts & ops: commissions, partner reporting, day-to-day optimization within the rules of the program. | Validation: proving whether partners/offers/timing actually create incremental revenue (and not just capture existing demand). |
| Common failure mode | Last-click gravity: over-rewards whoever shows up last (often coupon/loyalty at checkout), so models trained on it optimize for proximity, not impact. | Underpowered tests: too small/short/noisy experiments lead to inconclusive results, false negatives, or overconfident “no lift” calls. |
| Key question it answers | “Who gets credit?” | “Did we create lift?” |
- Use attribution data to operate (payouts, partner reporting, day-to-day).
- Use incrementality to validate (whether your “best offer + best time” recommendations are actually creating lift).
If you only remember one thing from this section, make it this: a predictive ranking is only as honest as what you call “success.” The win isn’t a spike. The win is a system you can trust next month.
Pick a prediction target you can audit: EPC, CVR, AOV, LTV, refund rate, and ‘new-to-file’ share
Prediction targets that map to real decisions—and can be audited without a PhD:
- CVR (conversion rate) by segment/partner type
- EPC (earnings per click) or margin-adjusted EPC
- AOV (average order value)
- Refund/return rate (this is where “great offers” go to die)
- NTF share (new-to-file / new customer rate)
- LTV / CLV (careful—more on that later)
ReferralCandy’s forecasting guide is basically a permission slip to keep it simple: clicks, conversion rate, AOV, commission rate, refund rate, and scenario tabs you update monthly (ReferralCandy). Boring. Effective.
Also: partner types behave differently. ReferralCandy reports content/influencer affiliates averaging 2–5% conversion rates, while coupon affiliates often sit at 1–2%—useful as directional context, not gospel (ReferralCandy). Take this with a grain of salt if you’re in a totally different vertical.
Alright, now we can talk tactics without lying to ourselves.
The data you actually need (and the tracking setup that stops your model from hallucinating)
Models don’t fix missing instrumentation. They just give your missing data a confident haircut.
Minimum viable dataset for offer + timing prediction:
- Click logs with subID (partner ID, placement ID, creative ID)
- Conversion events (with timestamps and order IDs)
- Revenue + margin inputs (AOV, gross margin proxy)
- Commission terms (rate, tier, caps, bonuses)
- Refund/chargeback flags
- Device + geo
- Partner type (content, creator, coupon/loyalty, email, etc.)
- Landing page ID / variant
- Promo metadata (coupon code used, start/end dates)
Features & Specs
| Feature | Details |
|---|---|
| Click logs (with subID) |
Example fields: click_id, timestamp, partner_id, subID/placement_id, creative_id, offer_id, landing_page, device, geo, referrer, UTM params
Granularity: Click-level
Typically lives in: Affiliate network + analytics (redirect/click tracker)
Powers decisions: Offer score (EPC/CVR prediction), timing (hour/day patterns), fatigue stop (CTR/CVR decay by creative/placement)
|
| Conversion events (orders) |
Example fields: order_id, order_timestamp, click_id (or attribution_id), customer_id, offer_id, revenue, margin/COGS, coupon_code, new_to_file flag, attribution model, partner_id
Granularity: Order-level (ideally linked back to click-level)
Typically lives in: Ecommerce/analytics + affiliate network (postback/pixel)
Powers decisions: Offer score (CVR/AOV/margin-adjusted EPC), timing (conversion lag + daypart), incrementality validation (baseline outcome measurement)
|
| Attribution linkage (click ↔ order join keys) |
Example fields: click_id, attribution_id, session_id, gclid/fbclid (if present), partner click reference, postback_id, dedupe keys, lookback window
Granularity: Click-level + order-level (relationship table)
Typically lives in: Network + analytics/attribution platform
Powers decisions: Offer score (honest labels), timing (lag-aware scoring), incrementality validation (prevents “last-click gravity” from becoming your training truth)
|
| Commission & payout rules |
Example fields: commission_rate, tier thresholds, bonus rules, caps, exclusions, partner-specific overrides, effective dates
Granularity: Daily (effective-dated) + order-level application
Typically lives in: Affiliate network + internal finance sheets/tools
Powers decisions: Offer score (margin-adjusted EPC/ROAS), timing (promo windows), fatigue stop (avoid over-serving low-margin promos)
|
| Refunds, returns, chargebacks |
Example fields: order_id, refund_timestamp, refund_amount, return_reason, chargeback_flag, net_revenue, reversal_status (commission reversal)
Granularity: Order-level (with lag)
Typically lives in: Payment processor + ecommerce platform + network (reversals)
Powers decisions: Offer score (quality-adjusted value), incrementality validation (lift that sticks), fatigue stop (detect “promo attracts low-quality buyers”)
|
| Customer status (new-to-file / returning) |
Example fields: customer_id, first_order_date, NTF flag, cohort, prior_orders_count, prior_revenue
Granularity: Order-level + customer-level
Typically lives in: CRM/CDP + ecommerce database
Powers decisions: Offer score (optimize for acquisition vs harvest), timing (winback vs first-purchase windows), incrementality validation (lift on true new customers)
|
| Creative & placement metadata |
Example fields: creative_id, format (banner/text/email), message angle, discount depth, start/end dates, placement name, page context, partner type
Granularity: Daily (effective-dated) + click-level join
Typically lives in: Network + internal creative/ops tracker
Powers decisions: Fatigue stop (creative decay), timing (rotation cadence), offer score (which message works for which segment)
|
| Exposure / send volume (for timing + fatigue) |
Example fields: impressions (if available), email sends, push sends, page views, placement traffic, frequency caps, partner traffic estimates
Granularity: Daily (sometimes hourly) + placement-level
Typically lives in: Analytics + ESP/marketing automation + partner reporting
Powers decisions: Timing (when to deploy), fatigue stop (frequency/overexposure), offer score (normalize performance by opportunity)
|
| Incrementality test design & results |
Example fields: test_id, holdout/control assignment, start/end dates, eligibility rules, outcome metrics (revenue, orders, NTF), lift estimate, confidence intervals
Granularity: Daily (rollups) + experiment-level
Typically lives in: Analytics/experimentation platform + internal BI
Powers decisions: Incrementality validation (audit the model), offer score calibration (penalize “last-click capture”), timing validation (does earlier exposure create net lift?)
|
| Time context (seasonality + promo calendar) |
Example fields: date, day_of_week, holiday flags, payday windows, sitewide promo periods, product launches, shipping cutoff dates
Granularity: Daily (sometimes hourly)
Typically lives in: Internal marketing calendar + analytics
Powers decisions: Timing (when offers actually work), offer score (seasonality-adjusted ranking), fatigue stop (avoid repeated promos in short windows)
|
Refgrow frames the point well: tracking is what lets you identify which affiliates, content pieces, and campaigns actually drive conversions—and they cite improvements tied to data-driven optimization (Refgrow). Rewardful makes the same argument for SaaS: define conversions clearly, track them consistently, and audit your setup regularly (Rewardful).
And yeah—this is the part that makes me twitchy. If your conversion event is sloppy, your model will be too.
Define conversion events like you mean it (sale vs trial vs qualified lead)
A “conversion” is not a universal truth. It’s a business decision.
Rewardful’s SaaS example is clean: at Rewardful, a conversion is a successful charge/payment in Stripe, not a free trial signup (Rewardful). That’s the right instinct. If you train on low-quality conversions, you’ll optimize toward partners and offers that generate low-quality conversions.
Failure mode: your model recommends “best offer” = the one that produces the most trials… that never become paying customers.
Exactly.
Pixel vs server-side tracking: choose the one that won’t disappear when browsers get grumpy
Pixel-based tracking is easy. It’s also fragile.
Refgrow lays out the tradeoff: server-side tracking is generally more reliable and less impacted by ad blockers, but it’s more complex to implement; hybrid approaches can give you the best of both (Refgrow). Rewardful similarly emphasizes robust tracking via pixels/URLs and payment integration, plus regular audits (Rewardful).
My read is: if you’re serious about predictive timing (hour/day patterns, fatigue detection), you want the cleanest timestamped event stream you can get. Otherwise you’re modeling browser behavior, not customer behavior.
✅ Pros
- Pixel (browser): simplest to ship; fast partner onboarding; easy to QA in the browser; good enough for low-stakes/low-volume setups.
- Server-side: most reliable under ad blockers/ITP (events originate from your server); better continuity across browsers/devices; stronger data control and governance.
- Hybrid: best practical coverage—pixel for redundancy + server for durability; reduces “missing conversion” gaps that make timing models hallucinate.
- Timestamp accuracy (timing models): server-side can stamp events at receipt/processing time consistently; hybrid lets you compare client vs server timestamps to detect drift/latency.
- Debugging/auditability: server-side provides centralized logs, replayable payloads, and clearer audit trails; hybrid enables cross-validation (did the click/conversion exist in both streams?).
- Recommended use cases: pixel fits early-stage ecom/SaaS and low volume; server-side fits high-volume ecom, subscription SaaS with longer funnels, and teams doing incrementality/forecasting; hybrid fits “serious but pragmatic” programs that need reliability without losing browser visibility.
❌ Cons
- Pixel (browser): most fragile under ad blockers/ITP and cookie restrictions; higher risk of undercounting and broken paths; timestamps can be noisy (tab sleep, network delays, user clock skew).
- Server-side: higher implementation complexity (auth, event schemas, dedupe, retries); requires disciplined logging and monitoring; can be harder to debug without good tooling.
- Hybrid: most operational overhead—two pipelines to maintain; requires deduplication logic and clear “source of truth” rules to avoid double-counting.
- Timestamp accuracy (timing models): server-side can still misrepresent “user moment” if you only log processing time; hybrid can introduce conflicts if you don’t reconcile client vs server time consistently.
- Debugging/auditability: pixel-only debugging is often “best effort” (blocked scripts, missing requests); server-side can become a black box if logs aren’t retained or correlated to subIDs/click IDs.
- Recommended use cases: pixel-only becomes risky as volume grows (small % loss = big $); server-side/hybrid may be overkill for tiny programs without engineering support or where partner platforms can’t accept server events cleanly.
Segment your partners before you model anything (creator/content/coupon behave differently)
Pooling partner types creates fake averages.
ReferralCandy explicitly recommends segmenting affiliates by type for forecasting (creators/influencers vs content partners vs coupon sites) because the performance profile and volatility differ (ReferralCandy). Impact’s incrementality framing also pushes you toward understanding where partners interact in the conversion path—which is basically segmentation plus journey context (impact.com).
So: partner type becomes a baseline feature. Not an afterthought.
If this feels strict, good—it means you’re building something that can survive volatility.
Offer selection: a practical scoring model you can run in a spreadsheet before you touch ML
I’m going to flatten this a bit…
Before you build a gradient boosting model or a fancy sequence network, you should be able to rank offers with a spreadsheet that your CFO wouldn’t laugh out of the room.
Here’s the “boring but deadly” offer score:
Features & Specs
| Feature | Details |
|---|---|
| Predicted orders (# orders expected) |
How to estimate: Forecast clicks × CVR by segment/partner/placement. Use recent 4–8 weeks, seasonality adjustments, and separate baselines for partner types (content vs coupon/loyalty). If you don’t have click forecasts, start with last period clicks and apply a conservative growth/decay factor.
Typical pitfalls: Using last-click conversions as “demand” (overweights coupon/toolbar); mixing partner types; ignoring creative fatigue and promo calendar; small-sample CVR volatility; double-counting orders across placements.
Suggested default if unknown: Use trailing 4-week median orders for that offer/partner type, then haircut by 20–30% for conservatism.
|
| AOV ($ per order) |
How to estimate: Use net AOV by segment and offer (exclude tax/shipping if they don’t contribute to margin). Prefer partner-type-specific AOV if mix differs (coupon may skew to lower AOV).
Typical pitfalls: Using gross AOV while margin is net; promo-driven AOV spikes that don’t repeat; blending new vs returning customers; ignoring product mix shifts.
Suggested default if unknown: Use sitewide net AOV for the segment; apply a 10% haircut if the offer is discount-heavy.
|
| Gross margin rate (margin % of revenue) |
How to estimate: Use contribution margin % at the order level (or category-level proxy). If possible, compute margin after COGS and variable fulfillment costs that scale with orders.
Typical pitfalls: Using blended company margin for a category-specific offer; ignoring shipping/handling subsidies; treating discount as “marketing” instead of margin reduction; margin changes with basket mix.
Suggested default if unknown: Use a conservative blended contribution margin (e.g., 30–40% for many DTC), or the lowest-margin category likely to be promoted.
|
| Refund / return rate (share of orders reversed) |
How to estimate: Use historical return/refund rate by offer/category and partner type, measured on a mature window (e.g., 30/60/90-day). Include chargebacks if relevant.
Typical pitfalls: Measuring too early (returns lag); using “approved commissions” as a proxy (network rules vary); ignoring partner-driven fraud; assuming refund rate is constant across promos.
Suggested default if unknown: Use a conservative refund rate (e.g., 10–20% depending on vertical) and increase it for coupon/loyalty placements if you’ve seen higher reversals.
|
| Commission rate (% of revenue or $/order) |
How to estimate: Use the contracted payout for the partner/offer (tiered rates, new-to-file bonuses, category exclusions). Convert to an effective rate on net revenue if needed.
Typical pitfalls: Forgetting tiers/bonuses; applying % to gross revenue when commission is on net; not modeling caps/minimums; ignoring “assist” or multi-touch payout rules if they exist.
Suggested default if unknown: Use your standard base commission rate for that partner class; if uncertain, assume the higher tier to avoid overestimating margin.
|
| Fixed fees ($ placement fees, tenancy, flat bonuses) |
How to estimate: Add any guaranteed payments (newsletter placement, homepage feature, influencer flat fee) and amortize across expected orders (or treat as a fixed cost line in the scenario).
Typical pitfalls: Hiding fixed fees outside the model; spreading fees across the wrong time window; forgetting creative/production costs; double-counting fees already netted in invoices.
Suggested default if unknown: $0 (but add a “fee unknown” flag). If the partner typically requires tenancy, assume a small placeholder and sensitivity-test it.
|
| LTV adjustment (multiplier or add-on value) |
How to estimate: Use incremental LTV uplift vs baseline by customer type (new-to-file vs returning), ideally from cohort analysis. Implement as a multiplier on margin (e.g., 1.0–1.5×) or as an added value per new customer.
Typical pitfalls: Counting non-incremental repeat purchases as “caused by affiliate”; using blended LTV that bakes in other channels; ignoring payback time and cash flow; overfitting to tiny cohorts.
Suggested default if unknown: Off by default (multiplier = 1.0). Only turn on when you can defend the cohort math.
|
| Incrementality confidence (0–1 discount factor) |
How to estimate: Assign a confidence factor based on evidence: holdout tests, geo experiments, partner-type priors, and overlap with “last-click gravity” behaviors. Example: content placements with clean paths score higher than coupon/toolbar intercepts unless proven incremental.
Typical pitfalls: Treating attributed conversions as incremental; giving every partner the same confidence; never updating confidence after tests; confusing “high volume” with “high lift.”
Suggested default if unknown: Use conservative priors: 0.3–0.5 for coupon/loyalty, 0.5–0.7 for content/influencer, 0.7–0.9 only when validated by experiments.
|
Expected margin-adjusted value
= (predicted orders × (AOV × gross margin) × (1 − refund rate))
− commissions
− fixed fees
± LTV adjustment
× incrementality confidence
ReferralCandy’s ROI model gives you the core structure—forecast revenue, subtract payout, test scenarios (ReferralCandy). Then you add the stuff affiliate people conveniently forget: refunds, partner-type differences, and whether the sales were incremental.
Don’t skip this step.
Baseline forecast: clicks × CVR × AOV (then subtract commissions and refunds)
Start here:
- Forecasted orders = clicks × CVR
- Forecasted revenue = orders × AOV
- Refund-adjusted revenue = revenue × (1 − refund rate)
- Commission payout = revenue × commission rate
- Contribution proxy = refund-adjusted revenue − payout (minus fees if any)
ReferralCandy literally provides a spreadsheet-friendly template structure with inputs, derived metrics, and scenario tabs (ReferralCandy). Refgrow’s tracking piece reinforces why this matters: you can’t optimize what you can’t attribute reliably (Refgrow).
Failure mode: using industry medians instead of your own last quarter. I did that once. It was… educational.
Run the boring checks first. They catch the expensive problems.
Add LTV (carefully): when higher commissions are still rational
Higher commissions can be rational when affiliate-sourced customers have higher lifetime value. ReferralCandy reports an observed pattern: affiliate-sourced customers having 1.5× higher LTV (their phrasing is “as seen in ReferralCandy reports”) (ReferralCandy).
Two caveats:
- That’s not universal truth. It’s a reported observation.
- Correlation isn’t causation. Your “affiliate customers” might just be your best customers who also happen to use content to research.
If you’re going to use LTV in the score, cohort it. Segment it. And sanity-check it against refund rate and churn signals (Northbeam’s churn analysis overview is a good reminder that retention dynamics are messy and segmented, not averaged (Northbeam)).
That sounds fine until you read the terms and realize there’s a trap door. LTV doesn’t excuse bad incrementality.
Incrementality confidence: a simple ‘sniff test’ before you scale a partner or offer
CJ’s incrementality study uses a classic test/control approach: test group had an affiliate click; control group didn’t, with controls for brand awareness, seasonality, and time to conversion (Junction by CJ). You probably won’t replicate that perfectly. That’s true—well, true in most teams without a dedicated measurement function.
But you can run lightweight versions:
- Geo split (if you have enough volume)
- Holdout windows (pause a partner/placement for a short window)
- Partner pause tests (carefully, with communication)
- Code suppression tests (for influencer code vs link interplay)
Use incrementality as a validation layer on your predictive offer ranking. If the “best offer” only wins when a coupon site is present at checkout, that’s not a win. That’s value capture.
Pay for value creation, not value capture.
Timing: predicting when to push an offer (and when to stop before fatigue eats your EPC)
Timing models fail in two predictable ways:
- They treat “best time to post” as universal.
- They ignore fatigue until performance is already compost.
This is where it gets weird: affiliate timing isn’t just when users buy. It’s also when your audience is still willing to listen.
Peak-time scheduling is real—but only if you measure it per partner and placement
Refgrow claims content released at peak times can generate 30% more engagement and lead to a 25% higher conversion rate (Refgrow). Useful motivation. Not a global rule.
So don’t build “best time to send” as a single number. Build it as:
- partner × placement × day-of-week × hour (or at least daypart)
- device split (mobile timing can be a different animal)
- offer category (seasonality matters)
And yes, you’ll find patterns. But they’ll be local patterns.
Now zoom out: what would this look like if your top partner disappeared tomorrow?
Fatigue signals to feed your timing model: frequency, CTR decay, rising costs, negative feedback
Northbeam cites a Meta finding: after four repetitions of the exact same creative, click likelihood dropped by about 45% (Northbeam). They also give a practical rule of thumb: frequency above 3–4 impressions per user often signals it’s time to refresh (Northbeam).
Neil Patel’s write-up adds broader sentiment stats—91% of users feel ads are more intrusive, 87% feel there are more ads than ever—and flags frequency scores between 3 and 5 as a red flag (Neil Patel).
Translate that into affiliate reality:
- Newsletter sponsorships: watch CTR decay across sends for the same angle
- Influencer whitelisting / paid amplification: watch frequency and negative feedback
- Retargeting to affiliate landers: watch rising CPC/CPM and falling CVR
- Repeated swipe copy: watch reply sentiment and unsubscribes (if you have access)
Your timing model should learn not just “when to push,” but “when to stop.”
Refresh rules: rotate creative before performance collapses (not after)
Northbeam’s remedies list is basically the playbook: creative rotation, frequency capping, segmentation/exclusion, monitoring/alerting, and structured testing (Northbeam). Neil Patel echoes the same prevention tactics: refresh creatives, rotate audiences, use dynamic creative tools, monitor in real time (Neil Patel).
Failure mode: one “winning” creative gets over-served until it dies. I’ve watched teams do this like it’s a rite of passage.
Don’t.
Try it on one offer, one partner type, one traffic source. Then scale what holds up.
From heuristics to predictive models: what to build first (and what to skip until you have volume)
Rewardful lists “use predictive analytics” as a best practice for affiliate conversion tracking (Rewardful). I agree with the spirit. I just don’t want you to confuse “predictive” with “accurate.”
And I hate how often this gets glossed over: AI won’t solve attribution on its own—that’s a direct quote from Emily Okrzesik via Acceleration Partners’ ASE recap (Acceleration Partners).
So here’s the staged build that survives my stress test:
Timeline
Build “boring but true” baseline performance by partner type × offer × segment (e.g., device, geo, new vs returning). Use simple aggregates (CVR, EPC, AOV, refund/return rate, NTF share) and document known biases (last-click gravity, promo leakage).
Exit criteria: Tracking audit passed (click→conversion stitching, subID coverage, dedupe rules, timestamp sanity); stable partner-type baselines (metrics don’t swing wildly week-to-week without a known cause); agreed definitions for success metrics and segments.
Add timing intelligence: seasonality, day-of-week effects, recency, rolling windows, promo calendar flags, and fatigue signals (e.g., declining CVR/EPC after repeated exposure). Keep models simple (regularized regression / gradient boosting) and prioritize interpretability.
Exit criteria: Minimum volume thresholds met per key segment/partner type (enough observations to avoid noise-driven “patterns”); feature pipeline is reproducible (backfills, late-arriving conversions handled); offline backtests show consistent lift vs baseline ranking across multiple time splits.
Separate “predicts last-click capture” from “creates lift.” Stand up holdouts/geo tests/partner-level experiments to estimate incremental impact of recommended offers and timing. Use attribution data to operate; use incrementality to validate.
Exit criteria: Holdout test completed with pre-registered success metrics; results are directionally consistent across at least one repeat cycle; guardrails defined (refund rate, margin, NTF share) and monitored; clear decision rule for when the model is allowed to override heuristics.
Operationalize: automated offer/placement recommendations, pacing, and suppression (fatigue) with human-in-the-loop controls. Ship as a decision system (rank + constraints + audit logs), not a black-box score.
Exit criteria: Proven incremental lift at acceptable risk; monitoring + alerting in place (data drift, performance drift, partner mix shifts); rollback plan and manual override documented; governance established (who can change constraints, commissions, and experiment settings).
- Segmented baselines (spreadsheet score + partner-type splits)
- Time-series features (seasonality, daypart, promo windows)
- Incrementality validation layer (holdouts/geo splits)
- Automated decisioning (rank offers, recommend windows, flag fatigue)
That’s the order. Not because it’s sexy. Because it’s auditable.
Feature ideas that don’t require a data science team: recency, seasonality, partner type, landing page, incentive changes
If you have a change log (I keep one like a lab notebook because otherwise you’re just telling yourself stories), you already have features:
- Recency: days since last promo for this segment
- Seasonality: week-of-year, holiday proximity
- Partner type: content vs creator vs coupon
- Landing page variant: A/B bucket
- Incentive changes: commission tier changes, bonus windows
- Offer availability: stockouts, shipping cutoff windows
- Refund rate trailing window
ReferralCandy’s scenario-tab approach is a reminder to update assumptions monthly, not once a year when someone panics (ReferralCandy). Refgrow’s tracking emphasis supports the idea that you should be feeding models with real, timestamped performance signals (Refgrow).
Small note: if you don’t log changes, your model will attribute performance shifts to “seasonality” when it was actually your checkout breaking on iOS. Ask me how I know.
Model outputs that map to actions: offer rank, send-time window, and ‘do not promote’ flags
Outputs should be operational:
- Offer rank by expected contribution (not just revenue)
- Send-time windows per partner/placement (not “Tuesday at 9am” for everyone)
- Do-not-promote flags when fatigue risk is high or refund rate spikes
- Commission sensitivity (what happens if we move from 10% → 12%?)
Northbeam’s fatigue signals give you the “stop” logic inputs (Northbeam). Refgrow’s peak-time and A/B testing claims give you the “when” and “test” motivation (Refgrow).
If you disagree, I’m open to it—just show me what you’re measuring.
Operational loop: test → learn → update commissions/creative → re-forecast (monthly, not vibes-based)
This is the part most teams skip because it’s not a dashboard. It’s governance.
Acceleration Partners quotes George Box: “All models are wrong, some are useful” (Acceleration Partners). That’s the right posture. Models are tools, not truth.
So set a cadence:
- Monthly forecast vs actual review (by partner type)
- Incrementality check-ins (at least quarterly, more if you’re changing terms)
- Creative fatigue alerts (weekly)
- Commission tier review (monthly/quarterly depending on volume)
And keep an audit trail. No tracking. No trust.
A/B tests that matter for affiliates: landing pages, offer framing, and commission tiers
Refgrow claims A/B testing powered by tracking data sees a 20% boost in effectiveness (Refgrow). The specific number isn’t the point; the operational lesson is.
Tests I actually like in affiliate contexts:
- Landing page variants (speed, clarity, objections)
- Offer framing (bundle vs single, guarantee language, shipping thresholds)
- Commission tiers (NTF bonus vs flat increase)
- Code vs link attribution rules (especially for influencer hybrids)
One variable at a time. Segment by partner type. Document the change.
Future-you will thank you.
When to change commissions (and when to fix conversion hygiene instead)
Here’s where last-click gravity quietly pulls the whole program off course.
ReferralCandy’s ROI model makes commission sensitivity obvious: payout is a direct function of revenue × commission rate (ReferralCandy). If performance is down, raising commission can be a band-aid that attracts partners who are better at extracting value than creating it.
So before you change commissions, check:
- CVR drop-offs (did the funnel get worse?)
- Refund/return rate (did “conversion” quality degrade?)
- Partner mix shift (did coupon/loyalty take more share?)
- Fatigue signals (did creative die?)
Impact’s incrementality framing is the north star here: reward partners who create unique value, not just those who show up last (impact.com).
You don’t need more tactics; you need fewer unknowns.
Failure modes (because affiliate is incentives in spreadsheet form)
Look—this is where people get burned.
Common failure modes when you add predictive analytics to affiliate:
- Optimizing for last click → you pay for your own customers
- Ignoring refunds/returns → your “best offer” is a margin leak
- Creative fatigue blindness → timing model keeps pushing into a dead audience
- Data quality gaps → clean dashboards, dirty reality
- Competitor mimicry → you copy terms without understanding their unit economics
This is also where networks get blamed for problems that start in your own setup.
Optimizing for last click: how you end up paying for your own customers
Acceleration Partners calls out the blind spot: last-click ignores earlier touchpoints like influencer awareness and content education (Acceleration Partners). Impact’s incrementality guide frames the fix: measure unique value created, not just credited conversions (impact.com).
If your model is trained on last-click labels, it will recommend “more coupon.” That’s not insight. That’s gravity.
Run incrementality tests. Rebalance incentives. Or accept that you’re paying for checkout interception.
Data quality traps: missing conversions, cross-device gaps, and ‘clean’ dashboards that hide leakage
CJ’s study notes deterministic and cross-device matching to unique profiles as part of their methodology—an ideal, not always something you can replicate perfectly (Junction by CJ). Refgrow’s tracking guide is full of the usual suspects: missing conversions, incorrect attribution, cross-device issues, and the need for testing and troubleshooting (Refgrow).
So do multi-source validation:
- Network report vs analytics vs payment system
- SubID integrity checks (are placements labeled consistently?)
- Reversal rate monitoring by partner type
- Spot checks on top paths (what’s actually happening?)
If you’ve ever stared at a reversal report at midnight, you’ll get it.
Templates: the ‘offer + timing’ worksheet (inputs, outputs, and the one metric you won’t compromise on)
I’m not attaching a file here, but you can copy this into Sheets in ten minutes.
Inputs (by partner type × segment × offer):
- Clicks
- CVR
- AOV
- Gross margin % (or contribution proxy)
- Commission rate / tier
- Refund rate
- NTF share
- LTV proxy (optional)
- Fatigue signals: CTR trend, frequency (if paid), negative feedback flags
- Change log notes (commission changes, landing page changes, promo windows)
Outputs:
- Forecasted orders = clicks × CVR
- Forecasted contribution = (orders × AOV × margin × (1 − refund)) − commissions
- Offer rank (by contribution)
- Timing window recommendation (daypart/day-of-week)
- “Do not promote” flag (fatigue or refund spike)
Required column (non-negotiable):
- Incrementality check status (none / planned / in progress / validated)
ReferralCandy’s template approach is the backbone here—inputs, derived metrics, scenario tabs (ReferralCandy). Northbeam’s fatigue signals give you the stoplight logic (Northbeam).
That’s the whole point: make the incentives obvious, then make them fair.
CTA: If you want, reply with your vertical (ecom vs SaaS), partner mix (rough % content/creator/coupon), and your conversion definition. I’ll tell you which 3 columns to add first so your “predictive” system doesn’t become an expensive vibes machine.
Quick checklist: the boring setup that makes predictive analytics worth doing
- Define the outcome variable (revenue vs contribution vs NTF contribution)
- Segment partners before modeling (content/creator/coupon)
- Verify tracking end-to-end (pixel vs server-side; audit regularly) (Rewardful)
- Log changes in a change log (commissions, landing pages, promos)
- Add refund/return rate to every offer score (ReferralCandy)
- Build fatigue alerts (CTR decay, frequency thresholds, negative feedback) (Northbeam)
- Run a lightweight incrementality test before scaling (Junction by CJ)
- Review forecast vs actual monthly (and write down what changed)
The win isn’t a spike. The win is a system you can trust next month.
Sources
- Affiliate Revenue Forecasting: Templates & Models for 2026 (ReferralCandy)
- Affiliate Conversion Tracking: Proven ROI Tips (Refgrow)
- Affiliate Conversion Tracking: 2026 Guide for SaaS (Rewardful)
- Ad Fatigue in Digital Marketing: How to Recognize & Remedy It (Northbeam)
- Ad Fatigue: What It Is & How to Prevent It (Neil Patel)
- Incrementality 101: Understanding What it is and How it… (impact.com)
- Smarter Attribution: Moving Beyond Last-Click in Affiliate Marketing (Acceleration Partners)
- A Study of Affiliate Incrementality Whitepaper (Junction by CJ)
- Churn Analysis: Identifying Why Customers Leave (Northbeam)