
Multi-Touch Attribution Conversion Volume Requirements: Honest Guide for Affiliates
Operators often buy the attribution model first and count conversions later. That sequence is backwards, and it is the single most expensive mistake in small and mid-sized affiliate programs. The dashboard looks precise, the model comparison chart looks scientific, and nobody has written down how many attributable conversions actually exist in a month.
This is a volume-gate tutorial, not a vendor shootout. The punch line before anything else: volume picks the model, and below the floor, multi-touch attribution lies.
Prerequisites: Data Access and the Written Decision Rule Before the Volume Gate
Gather three things before you touch any attribution setting. First, admin access in your affiliate network, so you can see partner-level conversion totals, traffic controls, and any geo or suppression toggles. Second, a GA4 or order-management-system view that shows monthly conversions, segmented by channel and partner type. Third, a blank spreadsheet.
The spreadsheet gets one number first: monthly attributable conversions. Not clicks, not sessions, not impressions. Conversions counted the way your commission payouts actually count them. If that number does not exist in a single cell, stop here. Everything downstream depends on it, and I recommend refusing to open a vendor comparison chart until that cell exists.
Now write the one-sentence decision rule, before touching any setting. A version that works: “If monthly attributable conversions sit below the honest floor, the program stays on last-click and I do not shop for paid multi-touch attribution this quarter.” Boring on purpose. Writing it in advance prevents the most common failure mode: enabling a model to look sophisticated, then rationalizing the noise afterward.
You also need your channel count. An affiliate program running one traffic source does not need a multi-touch model at all. The model exists to split credit across multiple touchpoints. One touchpoint means nothing to split.
Checkpoint: You have admin access, a spreadsheet cell with monthly attributable conversions, the channel count written next to it, and a one-sentence decision rule saved before any model settings change.
Count Attributable Conversions (The Volume Gate)
Goal: get a defensible monthly attribution count and a go/no-go read on whether any algorithmic model is justified.
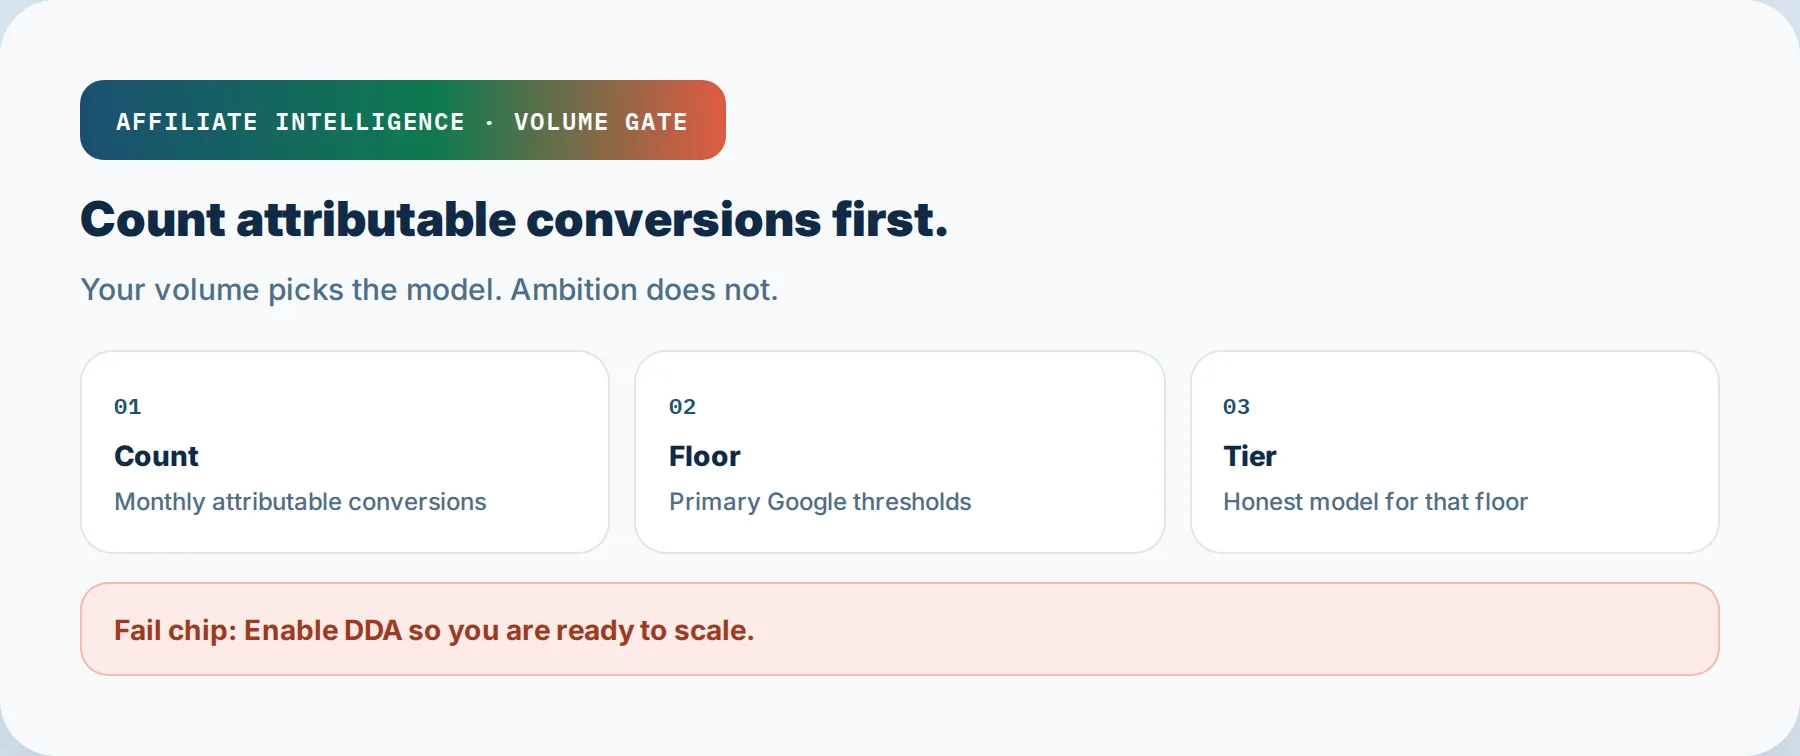
The volume gate is simple: monthly attributable conversions enter the logic, a floor check happens in the middle, and the model tier falls out the bottom. If conversions sit below the floor, skip multi-touch attribution and stay on last-click. The failure to avoid is enabling data-driven attribution so the program looks “ready to scale” when the underlying count cannot support it. That is theater, not measurement.
Here is the only command that matters in this step, built as a spreadsheet block:
Why this works. Multi-touch attribution produces defensible output only when enough conversion paths actually contain multiple interactions. If 80% of your conversions are single-touch, the model has nothing to distribute, and data-driven attribution returns something close to last-click anyway. Counting first is the only way to see that before you spend.
The primary floor comes from Google’s own documentation. Google Ads states that all conversion actions are eligible for data-driven attribution regardless of volume, but recommends at least 200 conversions and 2,000 ad interactions in supported networks within 30 days for the model to perform best (Google Ads Help). Read that sentence carefully. It is not a hard requirement. It is a threshold below which the model runs but produces output you should treat as directional noise, not measurement.
If you are importing offline conversions into that volume count, the silent filters in Google Ads offline conversions not counting: the silent filters you’re missing matter before you trust the number.
A stricter practitioner floor for GA4 data-driven attribution is roughly 400 conversions per month, repeated across the industry as a stress prompt rather than a documented GA4 requirement (WeltPixel). Search Ads 360 sets a harder platform-specific gate: at least 15,000 clicks and 600 Floodlight conversions in the last 30 days to create a data-driven model (Google SA360 Help). Treat those secondary figures as platform thresholds, not universal eligibility laws.
I’ll say it again: below the floor, multi-touch attribution lies. Refuse to enable DDA just so the account looks ready.
Checkpoint: You have a monthly attributable conversion count in the spreadsheet, a multi-touch ratio next to it, and a clear read on which floor applies to your current volume.
Participation Is Not Causation
Goal: internalize the distinction between a touchpoint showing up in a journey and a touchpoint actually causing incremental sales. Miss this, and every floor check you just ran gets misused.
Multi-touch attribution describes who participated. It does not prove who caused the outcome. A conversion path tells you a shopper touched a review blog, then a paid search ad, then a coupon page. It tells you zero about whether that shopper would have bought anyway. Attribution is structured evidence that informs decisions, not proof that determines them (NicoDigital).
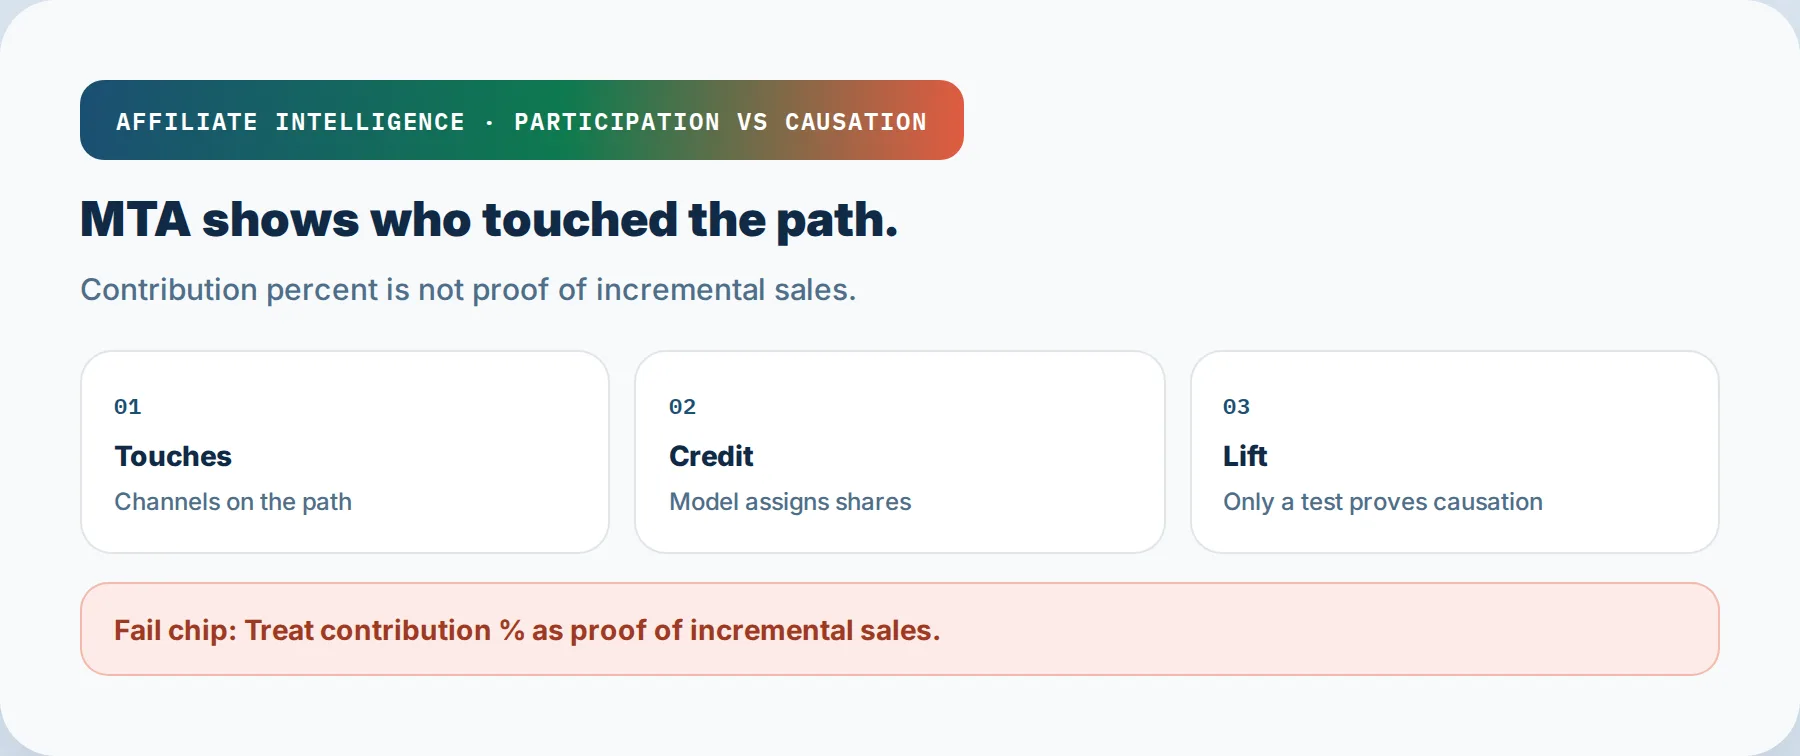
The split is simple: on one side is a touch map showing participation percentages across channels; on the other is a lift test asking whether removing a channel changes total revenue. The failure to avoid is treating contribution percentage as proof of incremental sales. The percentages look precise. That precision is the danger.
A concrete structural scenario, not a diary entry. Imagine a mid-size software affiliate program where Google Ads appears in most converting journeys. The dashboard credits the ads with 33% of conversions. The team runs a geographic holdout and finds Google was over-reporting conversions by roughly 33% compared to true incremental impact (Haus). Participation said “valuable contributor.” Causation said “mostly intercepted demand that already existed.” I’ll say it again: a channel can top every participation report and still add almost nothing. If that geographic holdout question is new territory, start with the incrementality geo-holdout testing for small programs guide.
Before I trust a vendor lift proof over a screenshot, I ask four questions. First, the control design: were exposed and unexposed groups actually comparable before treatment, or is this a pre/post with no counterfactual? Second, the suppression method: did they actually turn the channel off in one region, or did they model what would have happened? Third, the window: was it long enough for decay and return effects, or short enough that seasonality contaminates the read? Fourth, the outcome metric: does the vendor report incrementality, or participation rebranded as lift? If any of those four is vague, the screenshot is marketing material, not proof. The full step-by-step lives in the geo-holdout testing runbook for affiliate programs.
Checkpoint: You can state in one sentence the difference between participation percentage and incremental sales, and you have a four-question checklist you would put to any vendor before trusting their lift claims over a dashboard screenshot.
Honest Model Tiers by Volume (Use the Table)
Goal: map your monthly conversion count to a model tier without turning this into a vendor scoreboard. The tier is a decision, not a product demo.
The table is deliberately boring. Three bands, one decision per band.
Why the under-200 tier says “skip paid MTA entirely.” Below that floor, algorithmic models return confidently precise output built on statistical noise. A low-volume DDA model does not fail with an error; it returns a result. That is worse, because the result looks usable and is not. A small program with one or two channels gets more from a spreadsheet than from a platform license. If you are determined to build a joined view from raw exports first, the multi-channel attribution without enterprise tools guide owns that job.
The 400 band is not a universal law. It is a practitioner rule of thumb repeated across GA4 discussions, and it matters only as a stress prompt: if you are well under it, do not pretend the DDA output is stable (WeltPixel). Search Ads 360 is stricter: 15,000 clicks and 600 Floodlight conversions in 30 days (Google SA360 Help). That gap tells you something. Different platforms set different floors because the model’s claim to precision changes with the data feeding it.
Do not game the threshold by adding soft conversions like add-to-cart to pad the count. That cheats the model into optimizing for the wrong action and turns your floor check into a false pass (Big Flare). I recommend keeping purchase conversions as the only ones that count toward the floor.
Checkpoint: You have written your monthly conversion count next to one row of the table and can state, in a single sentence, which tier applies and why.
Run First-Touch and Last-Touch Side by Side Before Commission Rule Changes
Goal: identify which partners introduce demand and which partners close it, before any payout rule changes. The delta between the two models is input for role mapping, not an immediate commission split.
GA4 does not offer first-click natively anymore. First-click, linear, time-decay, and position-based models were deprecated in November 2023, leaving data-driven and last-click (WeltPixel). You can still reconstruct first-touch from first-user source fields or the Path Exploration report. That is enough for the side-by-side.
The command here is a spreadsheet join, not a platform toggle. Pull last-click attribution for each partner for one month. Pull first-touch attribution for the same partners for the same month. Put them side by side, sorted by the delta.
What this table tells you that neither model says alone: Review blog A introduces demand that Coupon site B and Cashback C later capture. That is the entire point of running the two side by side before touching commission rules. If you cut the reviewer’s commission because its last-click numbers look weak, you are punishing the partner that creates the demand your closers harvest.
Treat the delta as input for partner role mapping, not as a new commission split. The side-by-side is role-mapping input only. Write the introducer and closer labels down, record the delta direction for each partner, and do not change commissions until an incrementality check supports it. I’ll say it again: first-touch and last-touch side by side is a diagnostic, not a payout engine.
If this role map feeds into partner offer timing, the offer selection timing without last-click lies guide is the next step.
Checkpoint: You have a single spreadsheet tab with last-click and first-touch conversions side by side for each partner, aligned by partner and month. The delta is labeled Introducer or Closer, the role map is written down, and no commission rule has been changed yet.
Hybrid Last-Click Payouts + Assist Reporting
Goal: keep payouts operational on last-click while feeding strategy with assist data. The hybrid lane is the correction to last-click’s downward bias on upper-funnel partners.
The hybrid lane is simple: last-click attribution drives payouts on one side; a separate assist report runs on the other, showing which partners contribute to conversions without being the final click. The failure to avoid is equal multi-touch commission splits straight off a vendor slide.
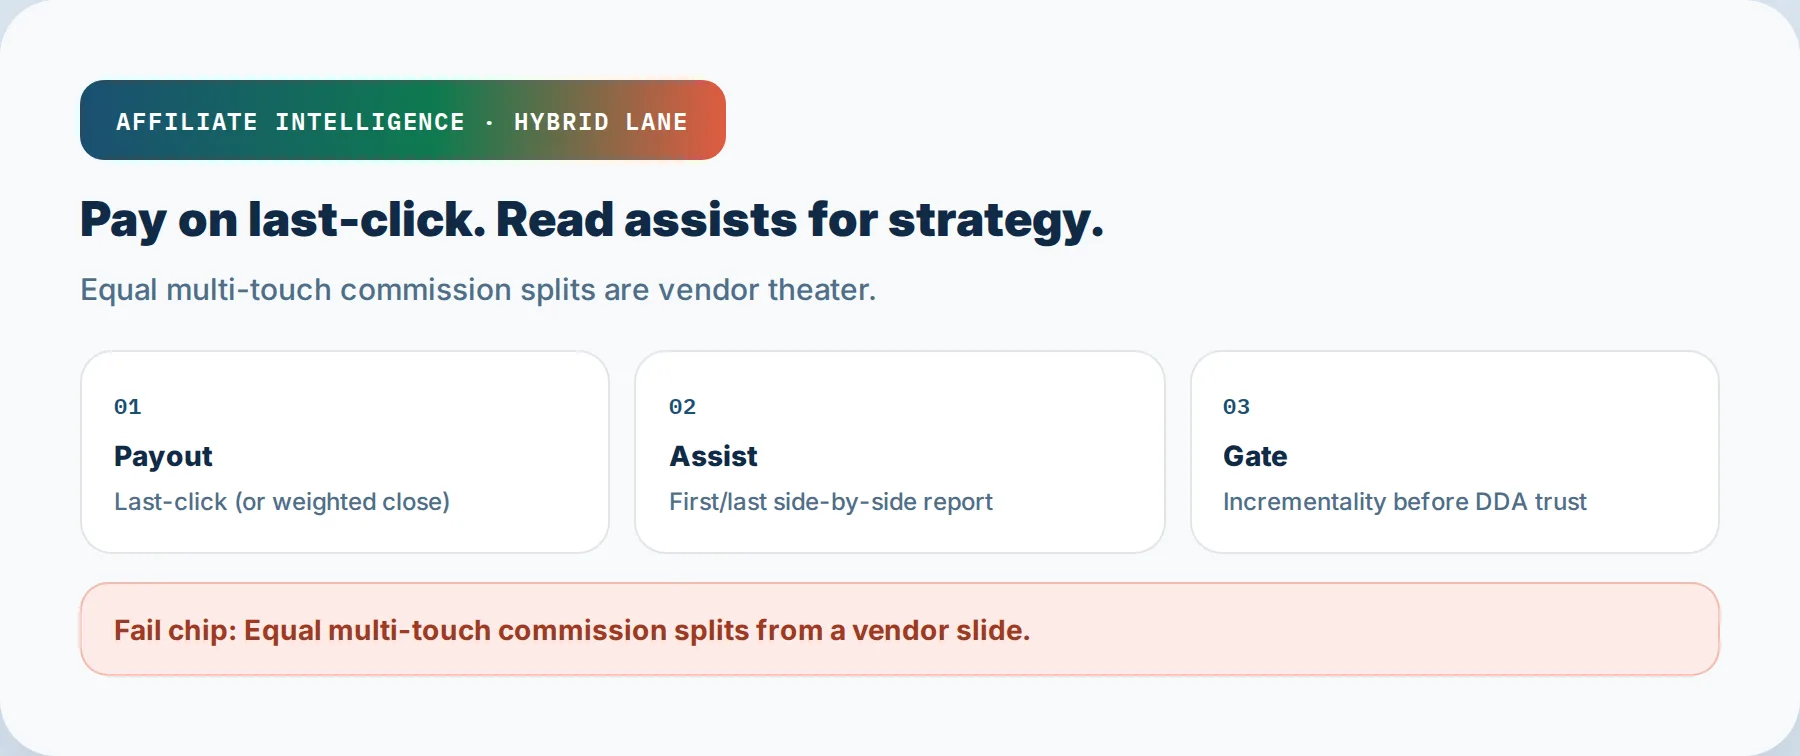
Structurally, what this looks like. Imagine a coupon partner showing 40% last-click share in a month, high and stable. An assist report shows that same partner introduced almost no new customers and appears almost exclusively in the final step of journeys that started elsewhere. Under a pure multi-touch split, that coupon partner receives commission for introducing demand it never introduced. Under the hybrid lane, it keeps last-click payouts while the assist report tells the program manager to renegotiate terms or reduce the partner’s dominance.
Last-click over-credits bottom-of-funnel capture channels and under-credits introducers (NicoDigital). The assist report is the correction layer. Do not make the assist report the payout engine. Make it the strategy feed.
I recommend paying commissions on last-click and using the assist report for two decisions only: which content and review partners deserve more placements, and which coupon or cashback partners deserve stricter terms. That separation preserves operations while fixing the bias.
Checkpoint: You have a payout rule that remains on last-click, an assist report running separately, and a decision on which partners get more placements versus stricter terms, with no equal multi-touch splits from a vendor slide.
Incrementality Litmus Before You Trust the Dashboard
Goal: run a cheap causal check before believing any attribution output, including the hybrid lane you just built. The guides referenced earlier own the how-to; this section owns the go/no-go gate.
Before I trust a DDA output, I run the feasibility gate and the evidence ladder. The core line: incrementality is not attribution. Attribution tells you who touched last. Incrementality asks whether the sale needed them at all. A model that reports participation can never answer the second question. Only a holdout can.
The cheap version runs in two passes. First, open the incrementality feasibility gate and evidence ladder in the small-programs guide referenced above. That piece is the gate. It asks whether you have comparable geos, a single partner type to test, a protected four-to-six-week window, and a written decision rule. If any answer is no, do not fake the holdout. Run proxies instead: new-to-file rate, coupon cannibalization signals, or a time-based on/off.
Second, if the gate clears, open the geo-holdout runbook referenced above for the step-by-step matched-market selection, parallel-trends plot, and difference-in-differences readout. That runbook is the how. This section will not rebuild it.
The litmus is this: before you trust any dashboard output enough to change a commission, ask whether a causal check exists. If it does not, the dashboard is participation theater. If it does, believe the causal result over the modeled percentage.
Checkpoint: You know whether your program clears the incrementality feasibility gate and, if it does, that the geo-holdout runbook is the next step. If it does not, you have named the proxy you will run instead, without faking a holdout.
Closing Decision Tree and Neighbor Guides
Goal: reduce the whole post to a one-page decision path and point to the neighbor guides for adjacent jobs so you do not rebuild them here.
The closing tree:
I recommend that exact path, in that order, for any small or mid-sized affiliate program choosing an attribution model. It costs a spreadsheet first, a holdout second, and a platform license last, if at all.
The neighboring guides own the adjacent jobs: offer selection without last-click lies lives in the predictive analytics piece; Google Ads offline conversion silent filters are in the guide referenced in the volume gate; and multi-channel attribution without enterprise tools is in the guide referenced in the model tiers section. Each of those appears once above, so you can stop reading here and start counting.
Checkpoint: You have the decision tree in one page and know which neighbor guide owns each adjacent job, so you can stop reading here and start counting.
Troubleshooting Common Issues
Issue 1: DDA is enabled, but monthly conversions sit well below 200.
A common failure mode: the model is technically running, which feels like progress. It is not. Below Google’s recommended 200 conversions and 2,000 interactions in 30 days (Google Ads Help), the model returns noise presented as precision. Fix: switch the reporting layer back to last-click, keep DDA only as a comparison view if you want, and do not act on DDA numbers until volume clears the floor. Do not pad the count with add-to-cart conversions to force a false pass.
Issue 2: Last-click and first-touch reports come out identical.
This usually means one of two things. Either your attribution paths are dominated by single-touch journeys, in which case there is nothing to compare, or your tracking never captured the early interactor. Fix: check the multi-touch ratio from the volume gate above. If it is below roughly 20%, the side-by-side looks identical because there is almost no multi-touch path data. Pull first-user source instead of first-touch attribution; it is a different field that survives single-touch truncation.
Issue 3: A vendor shows a contribution percentage but no lift test.
Before I trust that percentage, I ask the four questions from the participation section above: control design, suppression method, window length, outcome metric. If the vendor cannot answer all four, the number is participation, not causation. Fix: label it participation in your internal reporting and treat it as directional only. Do not use it to change commissions.
Issue 4: The coupon partner’s assist report is ignored.
A common failure mode: the assist report sits in a dashboard nobody reads, so the hybrid lane quietly reverts to pure last-click. Fix: attach the assist report to a named decision each month, either which partner’s terms get renegotiated or which content partner gets more placements. No named decision means the report is decoration. I’ll say it again: an assist report with no downstream action is not strategy.
Issue 5: The geo holdout came back inconclusive.
Do not round an inconclusive result up to significance. That is how operators convince themselves a partner is non-incremental when the data says “keep testing or run proxies.” Fix: extend the window if finance will tolerate it, narrow the scope to one named partner, or fall back to the proxy rungs: new-to-file rate and coupon cannibalization signals. The geo-holdout runbook has the full readout; the offline conversion silent filter guide is the check if you suspect offline conversion misses contaminating the read.
Issue 6: Finance wants a commission change based on a DDA printout.
The printout is participation. Finance thinks it is proof. Fix: show the first-touch and last-touch side-by-side table from above, then the incrementality result if one exists. When the causal number and the modeled number disagree, the causal number wins. If no causal number exists, say so plainly and run the incrementality feasibility gate before touching commission rules.