Why Industry Commission Rate Benchmarks Fail Operators
Prerequisites
The published industry band is not a starting point. It is a sanity check you earn the right to open only after your own numbers exist. Before trusting any table, assemble five things on one sheet:
- Contribution margin per order — revenue minus COGS, fulfillment, and payment processing. Not markup. Margin.
- Refund and clawback window — the exact days during which a customer can walk away and the commission can reverse.
- Retention or payback definition — how many months until a referred customer repays acquisition cost, and whether the curve flattens or compounds.
- Partner mix labels — content, coupon, loyalty, influencer. The same sticker rate lands differently across those types.
- Total channel fees — network fee, platform fee, payout processing, and any advertiser-side monthly cost if you run on a network.
The commission sustainability walkthrough covers the underwriting sheet if those columns feel unfamiliar. The point here is narrower: a published percentage is an invalid decision input until you can map it to those five columns. A benchmark article telling you that a vertical pays a recurring range answers a different question than whether your product can afford that rate at your retention and margin. Keep the two questions separate.
Checkpoint: You have one sheet with contribution margin, refund window, retention or payback, partner mix, and total fees filled. Any blank cell means the industry table stays closed.
The Published Percent Is Not a Rate-Card Input
The failure starts before the table loads. You assume an industry or competitor percentage is a valid rate-card input. It is not.
Industry and competitor commission tables answer one question: what do other programs appear to pay? Your rate card needs a different answer: what can this program pay on this customer, through this partner, after this retention behavior, without leaking margin? Those are not the same question. A published percentage is an average extracted from programs whose margins, refund rates, AOV, and partner mix you cannot see.
Take a structural scenario. Two operators run the same vertical at the same product price. One holds a high contribution margin, a short refund window, and a customer base that repurchases for several months. The other holds a thin contribution margin, an extended return policy, and a churn-heavy one-and-done base. Both read that their industry pays 15%. The first leaves money on the table; the second quietly loses it. Same sticker rate, opposite outcomes.
That is why the one-number answer fails. Before trusting any published percentage, map it to your own P&L. Treat the benchmark as a hypothesis about someone else’s unit economics, never as a default rate-card input. The economics sibling handles underwriting rigorously; here the task is naming the failure mode so you stop copying the table.
Checkpoint: You can state in one sentence why a published industry percentage does not transfer to your program without rewriting the rate card.
Map the Band: What Economics the Published Percent Silently Assumes
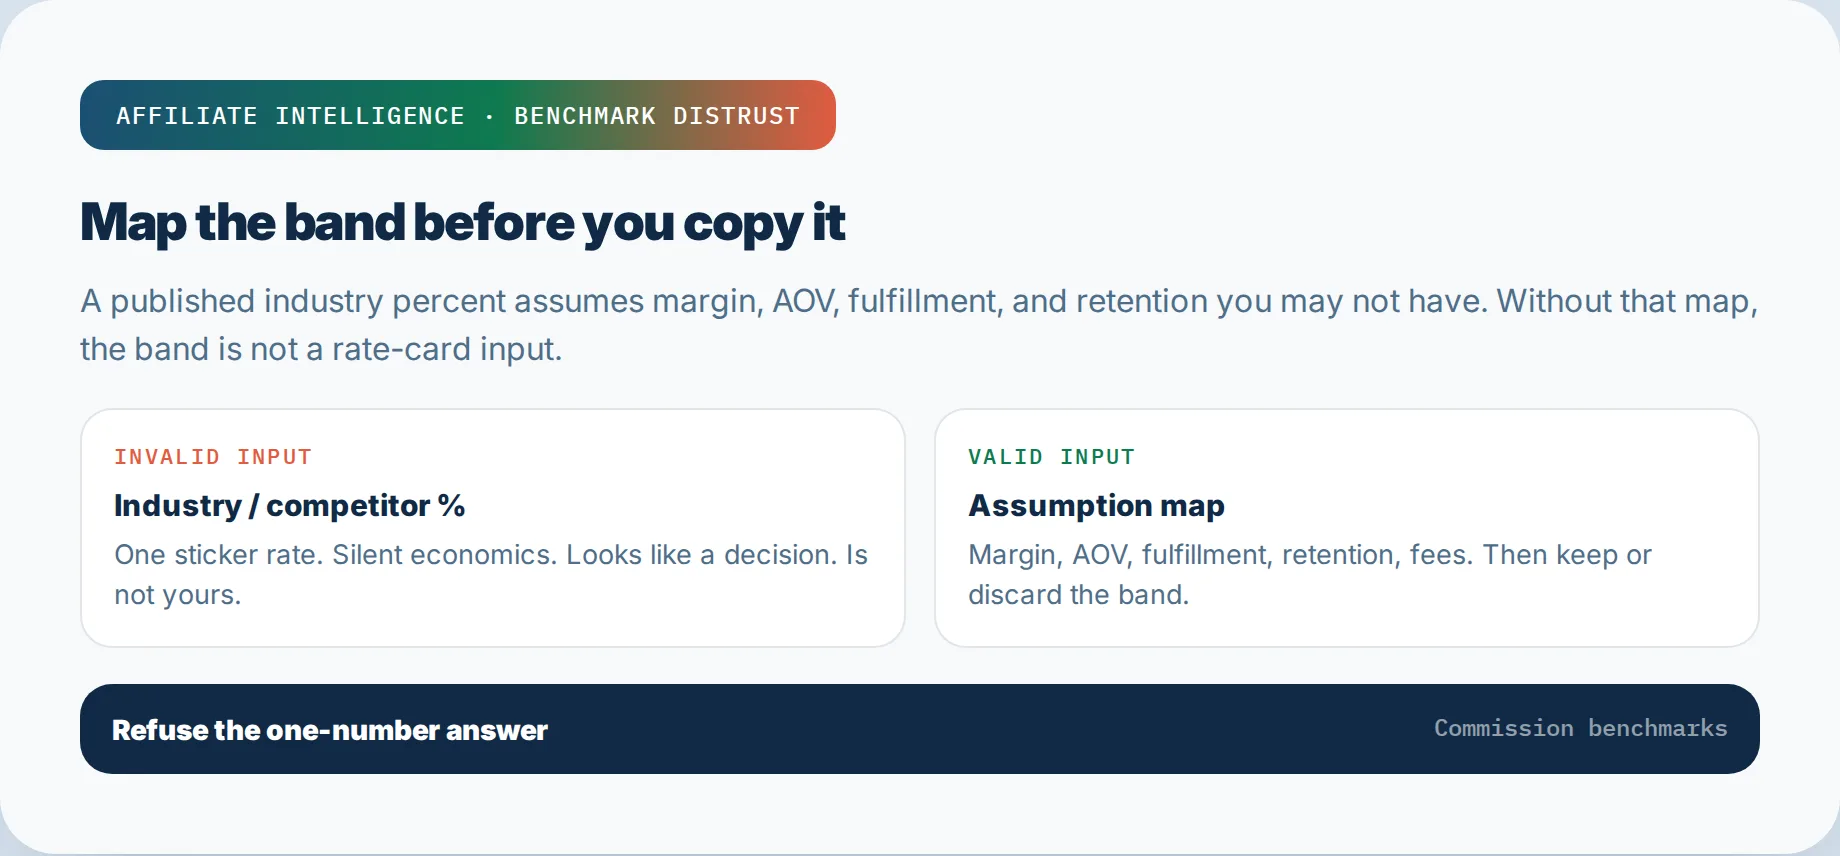
Every industry band is a bundle of silent assumptions. The percentage hides four variables: margin, AOV, fulfillment cost, and retention. When you copy the band, you inherit all four without knowing any of them.
The published range says that affiliate commission rates by industry fall in a window. It does not say what margin the seller assumed, what average order value the cohort carried, what it costs to fulfill, or how long the customer stays. A generous digital-product payout assumes near-zero marginal delivery cost. A lower physical-product payout assumes manufacturing, shipping, and returns eating the middle. Both percentages are arithmetic on top of unstated economics.
The right move is to map the band before you consider it. Take any published midpoint and reverse-engineer three questions. First: at my AOV, what absolute dollars does this pay? Second: after COGS and fulfillment, what contribution margin is left? Third: what retention assumption makes that residual safe? If you cannot answer those from your own orders, the band is decorative.
Prefer “map then discard” over “pick the midpoint.” The midpoint of an industry range is not a recommendation; it is the center of someone else’s spread. Pick your own midpoint from your own margin, then hold the published band up only after that number exists.
The industry-average problem is structural: an average flattens low-margin and high-margin operators into one number nobody actually ran. Map every band to assumed economics, then discard the band.
Checkpoint: You have written, for any band you were about to copy, the assumed margin, AOV, fulfillment cost, and retention it requires to be safe at your program.
Retention and Churn Decide Whether the Same Percent Is Safe
The same recurring commission is safe on a product with long retention and lethal on one with early churn. That is a retention-and-churn problem, not a percentage problem. The industry band does not know which customer you have.
Payback compounds the problem. If it takes several months for a referred customer to repay acquisition cost and the average customer churns before that month arrives, the program is underwater at any industry-typical rate. The right gate is a payback check before trusting the percentage: how many months until commission plus COGS is repaid, and what does the churn curve say about whether that month arrives?
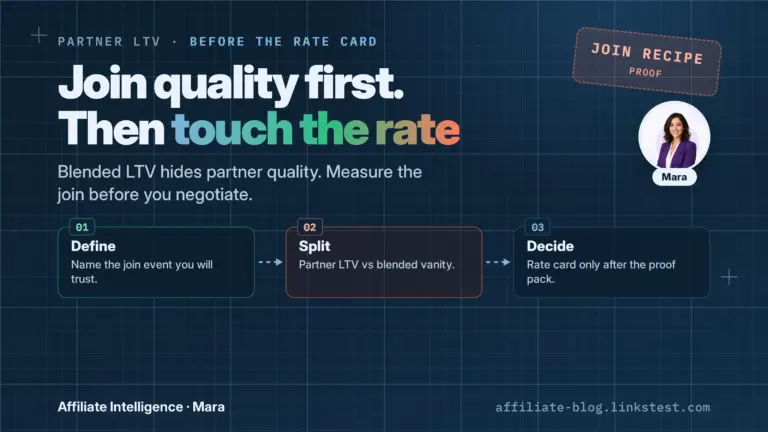
When blended retention hides the partner mix, use the partner-level LTV join before any rate decision. The join shows which partners’ customers compound and which flatten. Do not rebuild that join here. The point for this piece: you cannot argue that the industry pays a recurring range until you know whether your referred cohorts survive long enough for the percentage to clear payback. Check clawback windows lightly in the reversal workflow — a chargeback can reverse commission long after the sale if the terms allow it.
Checkpoint: You have run a payback check on your own referred cohorts and can state whether the typical industry recurring percentage is safe, marginal, or underwater at your retention.
Variable Pay-Only-on-Revenue Liability
Recurring commission creates a compounding lifetime payout liability even though each paid invoice makes the payout look free. The phrase “pay only on revenue” feels safe because the operator records revenue before the partner is paid. It is not a closed cost.
Use explicitly labelled sample arithmetic to see the mechanism. A $100-per-month plan at a 30% recurring rate, held for 20 months, pays the partner $600 — 30% of the total revenue collected over that window. The percentage never changed. The liability grew because the customer stayed. If churn arrives before breakeven, the back half of that payout was paid on revenue that never became contribution margin.
The Track360 recurring-commission comparison puts the point directly: a headline 30% commission costs anywhere from 13.5% to 30% of a customer’s 20-month revenue depending purely on the lifetime rule. Partners see the headline rate; the P&L sees the effective lifetime exposure. Design the rule, not just the percentage.
The liability is worst when retention is assumed rather than measured. A product with strong early renewals can support a recurring structure; a product with early churn cannot. The operator who sets a recurring commission on a churn-heavy cohort has signed an open liability against customers who may not stay long enough to fund it.
Checkpoint: You can separate the sticker percentage from the lifetime payout exposure on your own retention curve before agreeing to any recurring commission.
Effective Rate After Attribution Leakage Beats the Sticker Benchmark
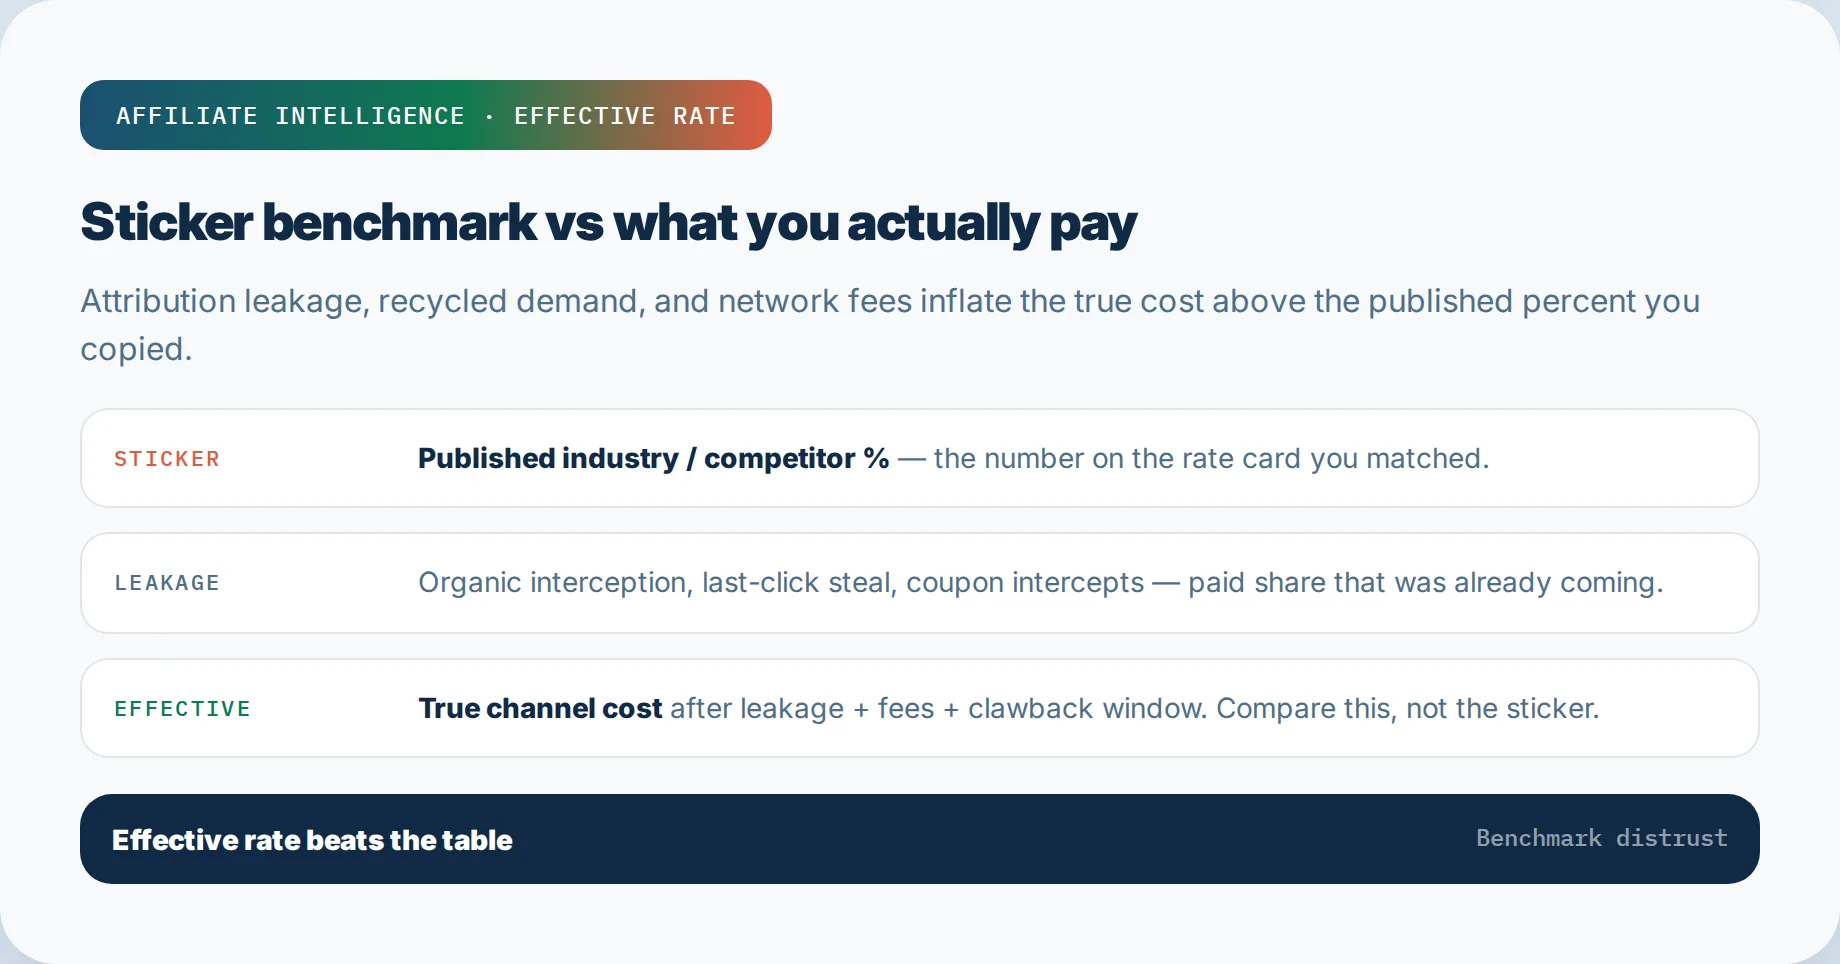
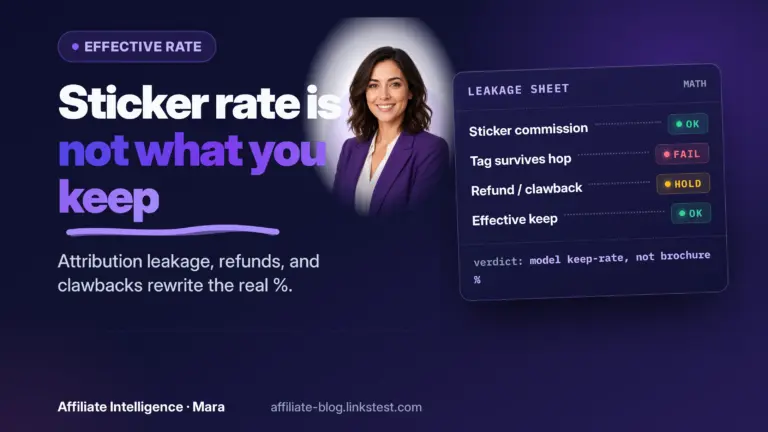
The sticker rate you copied is not the rate you will actually pay. Attribution leakage - organic interception, brand-jacking, last-click steal - inflates the effective commission above the headline.
Attribution leakage inflates the effective rate above the sticker; the effective affiliate commission rate after attribution leakage manual covers the full tagging and recompute method. Do not rebuild that protocol here. For checkout-layer harvest signals alone, see the coupon partner cannibalization signals.
Checkpoint: You know whether the sticker you were about to copy needs an effective-rate pass before competitor matching - and you open the leakage manual when it does.
Matching Competitor Rates Will Not Revive a Passive Program
A program that underperforms usually fails upstream of the commission rate. Activation, positioning, link quality, creative fit, and payout reliability break before the percentage does. Matching a competitor’s headline treats a symptom.
If partners are inactive, raising rates to the competitor’s published number is theater. The real blockers: a positioning line nobody can repeat, deep links that fail QA, creatives that do not match the audience, or payouts that arrive late and erode trust. A competitor rate cannot fix any of those.
Diagnose the partner operating system before touching the rate. Ask whether partners who do promote can actually convert. Ask whether approval and activation take days or weeks. Ask whether the dashboard gives them assets they need. If those are broken, a rate increase is money spent on friction that still does not convert. Fix activation first, then revisit rate.
The Impact.com guidance is direct: the most profitable programs are built by ignoring competitors, and copying a competitor’s rate means inheriting their business model without seeing their books. The Semrush example makes the point concrete. Semrush moved off a first-click program and rebuilt the structure around customer acquisition — paying partners for trial activations and new sales — and new partner sign-ups rose sharply. The change came from internal economics, not competitor rates.
Checkpoint: You have diagnosed the partner operating system — activation, positioning, link QA, payout timing — before any rate increase toward a competitor number.
Absolute Dollars and Conversion × AOV × Payout Beat Headline Percent
Headline percentage is the wrong scoreboard. Absolute dollars from conversion rate, AOV, and payout decide whether a partner bothers. A 25% commission on a $12 product pays $3; a 10% commission on a $500 product pays $50. The lower percentage pays more in absolute dollars. Programs get this backwards constantly.
Run the simple comparison: expected conversion rate × average order value × payout rate = expected earnings per referred conversion. That number, not the percentage, is what a partner weighs. The industry-band obsession with percentages hides this arithmetic.
Low AOV makes even a generous percentage worthless to partners. If your product sells for a small amount and the band says 20%, the partner earns a few dollars per sale and will not work for that. The right response is not always a higher percentage; sometimes it is a flat fee, a hybrid bonus, or a higher-converting offer. Percentage is one variable, not the scoreboard.
Checkpoint: You can rank the offers in front of you by expected absolute dollars per conversion, not headline percentage.
High Sticker Percentage Is a Red Flag, Not an Aspiration
An unusually high sticker percentage deserves skepticism, not aspiration. A large payout can signal thin margins, negative unit economics, clawback exposure, recycled demand, or terms that hide the true cost. The number that looks generous may exist only because the program cannot sustain the customer quality it claims.
Screen high rates the way the sustainability piece does. Ask whether the rate has a public history, whether the merchant has cut it before, and whether it survives a 20% reduction. A high number with several rate cuts behind it is a warning, not an opportunity.
A short screening checklist for any unusually high offer:
- Does the stated margin make the payout arithmetically possible without loss?
- Is there a long or opaque refund, chargeback, or clawback window?
- Does the program depend on recycled demand rather than new-to-file customers?
- Has the merchant reduced the advertised rate before?
- Are network or platform fees hidden in the fine print?
Checkpoint: You have asked each screening question before treating a high sticker percentage as an income opportunity.
Start Conservative and Resist Walking Back
The worst-case sequence is copy, launch, discover the margin cannot support it, cut the rate, lose partners. Cutting a commission is not a neutral adjustment. It is governed and painful. Awin’s contract rules limit reductions to a maximum 20% per change, once every 30 days, with at least seven days’ notice. Your network likely carries similar constraints. A rate you copy today can be hard to walk back gracefully.
Start conservative instead. Launch below the industry midpoint, then document a raise trigger tied to retention evidence — not partner pressure. A temporary launch bump with a defined review window beats locking a mid-band rate you cannot sustain. Start conservative and let the retention data earn the bump.
This is change-control discipline. The first rate is harder to reverse than you think, so make the first rate defensible from your own margin and reviewable against your own retention evidence. After that own-input foundation exists, the LTV-structure sibling covers caps, tapering, and gates. Do not rebuild those tiers here; the point is sequencing: conservative start, documented review, raise on evidence.
Checkpoint: Your base rate has a written review window and a documented raise trigger, so you never have to execute a copy-then-clawback.
Network and Advertiser Fees Hide the True Cost
The published percentage is not your total cost. Network fees, advertiser-side platform fees, payout processing, and team time stack on top. A headline rate can become a meaningfully higher fully loaded rate once those layers are added. If you built the rate card on the sticker alone, you are over budget before the first payout.
Public network fee examples show the spread. Awin’s Access plan lists $49 per month plus a 3.5% tracking fee; Accelerate’s published tier runs from £199 per month plus a 2.5% transaction fee, with USD pricing available on request. Impact lists platform tiers plus a transaction fee. PartnerStack Spark lists $0 per month plus a processing fee on commissions paid. Each line changes the effective payout before a partner receives a dollar.
Worse, most operators compare the rate against the wrong margin base. Markup and margin are different. A product with a 50% markup has a 33% margin. Using markup as the margin base makes a commission look affordable when it is not. The benchmark article never tells you this because it does not know your base.
Ask the network specific questions before underwriting:
- What advertiser-side monthly or platform fees apply?
- What tracking or transaction fee is charged on partner-driven sales?
- What payout processing cost is charged on commission paid?
- Are there setup, integration, minimum, or migration fees?
- What is excluded from the advertised platform fee?
Checkpoint: You have a total-cost number — commission plus network fees plus processing — compared against contribution margin, not markup, before touching any table.
Refuse the One-Number Industry Average
The published industry percentage is not a decision input. It is a conversation starter that becomes dangerous the moment it becomes a rate card. Refuse the single-number average because it hides margin, AOV, fulfillment cost, retention, attribution leakage, and channel fees in one flattened figure.
The correct sequence replaces the benchmark with your own inputs. First, map any published band to the economics it silently assumes. Second, run retention and payback against your referred cohorts. Third, run the effective-rate after leakage pass. Fourth, add network and advertiser fees to see the fully loaded cost. Fifth, start conservative because a public rate is easier to publish than to walk back.
After those inputs exist, the hand-off is controlled. Start with the partner-level LTV join to separate flat and compounding partners before any rate edit. Then underwrite sustainability from your own economics. Then build the structure — caps, taper, gates — on top of the join and economics. Those three steps are the replacement for the industry table. Not a substitute percentage cheat sheet. A sequence of your own inputs.
Checkpoint: The distrust answers are written, and the hand-off order — join, economics, structure — is queued.
Troubleshooting Common Operator Scenarios
Stuck copying competitor rates
Reframe the exercise. You cannot see competitors’ margin, retention, or refund behavior, so any match is a bet on hidden economics. Set a ceiling from your own contribution margin and CAC, then treat the competitor number as context, not control.
No retention data yet
The absence of a retention curve is a reason to freeze rate changes, not to guess. Use the new-to-file rate as an early quality proxy while the cohort matures. Hold the rate conservative until the first payback window clears.
Network fee opacity
If the network does not break out advertiser-side fees cleanly, demand the full fee schedule in writing. If it remains opaque, pad your fully loaded cost assumption and mark it estimated. Refuse to underwrite on the sticker alone.
Influencers needing fixed fees plus commission
Hybrid models exist for this. The fixed fee covers placement risk; the commission keeps outcomes aligned. Set both against the same contribution-margin ceiling, not against what an influencer demands. The fixed fee is not a pass to ignore the commission’s lifetime exposure.
Hand-off join, economics, then structure
Do not move from a benchmark table to a rate card. Move from the partner-level LTV join to the economics underwriting, then to the commission structure. That sequence produces a defensible rate. The benchmark does not.
This Week’s Distrust Questions
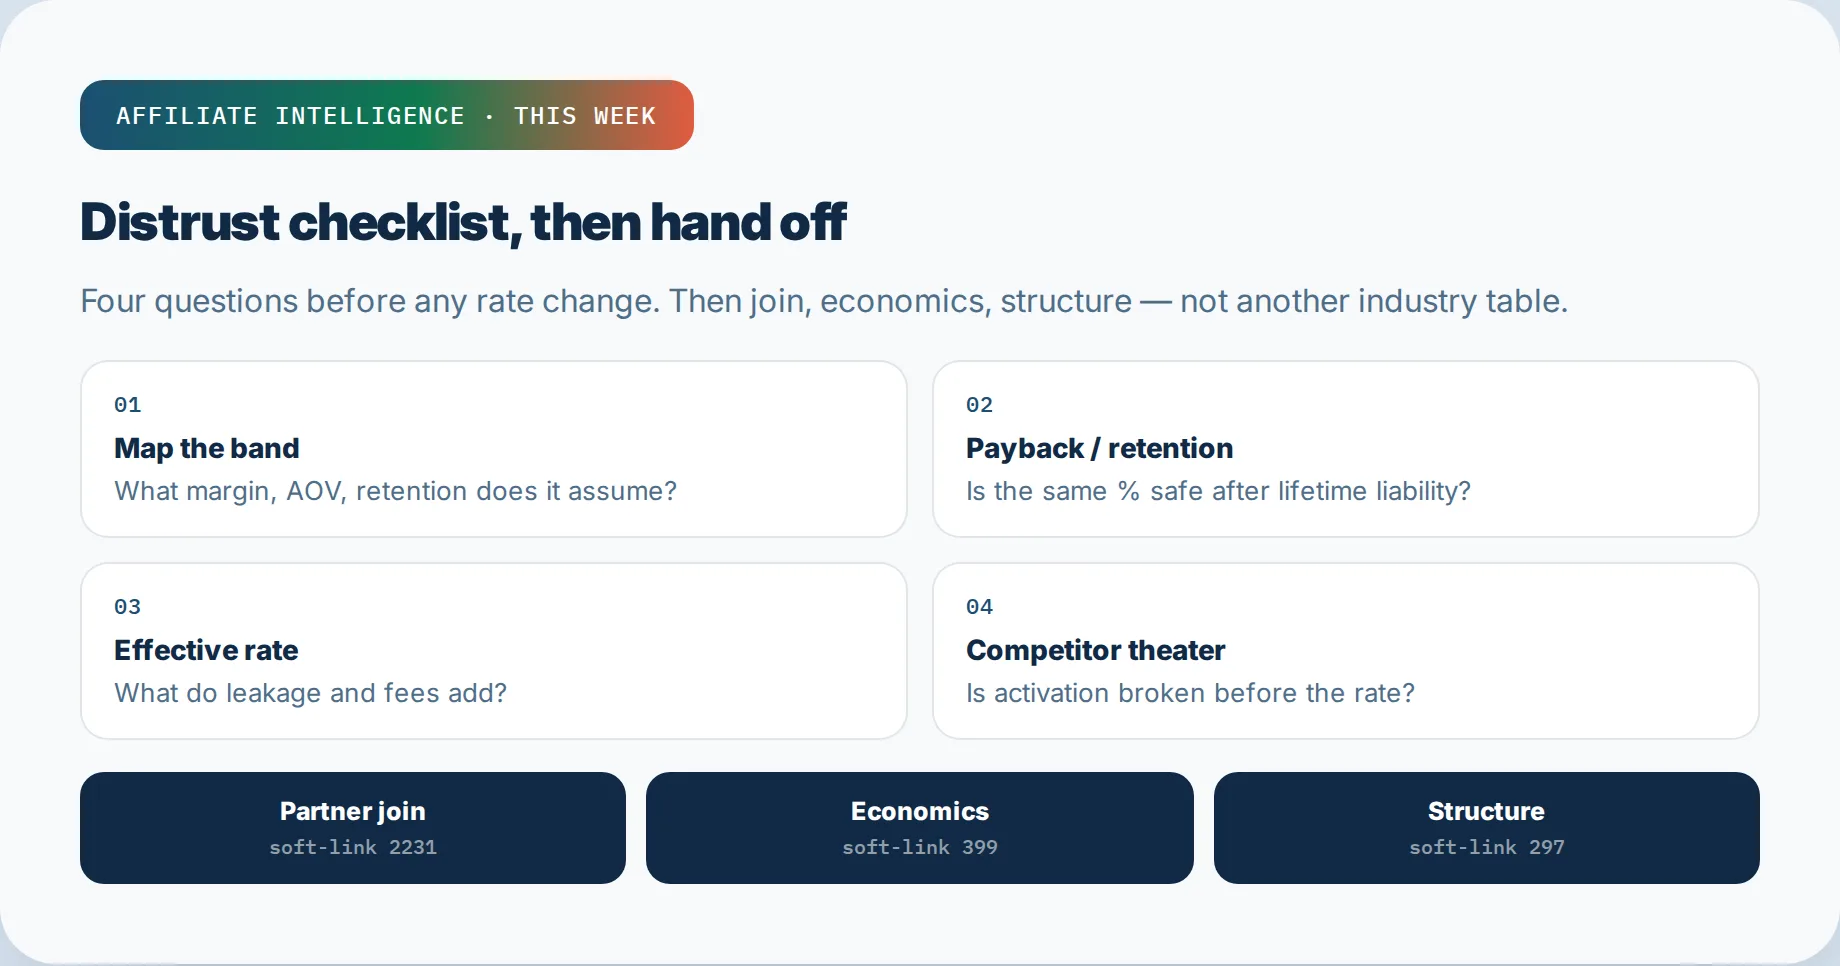
Close the week on four questions, not one number.
First, map the band. What margin, AOV, fulfillment cost, and retention does the published percentage silently assume, and does your P&L match? Second, retention and payback. Does your referred cohort survive long enough for the recurring percentage to clear payback, or is “pay on revenue” a lifetime liability you undersold? Third, effective rate. After attribution leakage, what commission per incremental sale are you actually paying, compared to the sticker? Fourth, reversibility. If you publish this rate, can you sustain it, or are you setting up a cut you will have to explain later?
If any answer points away from the benchmark, the benchmark was never your rate card. It was a prompt to do the underwriting.